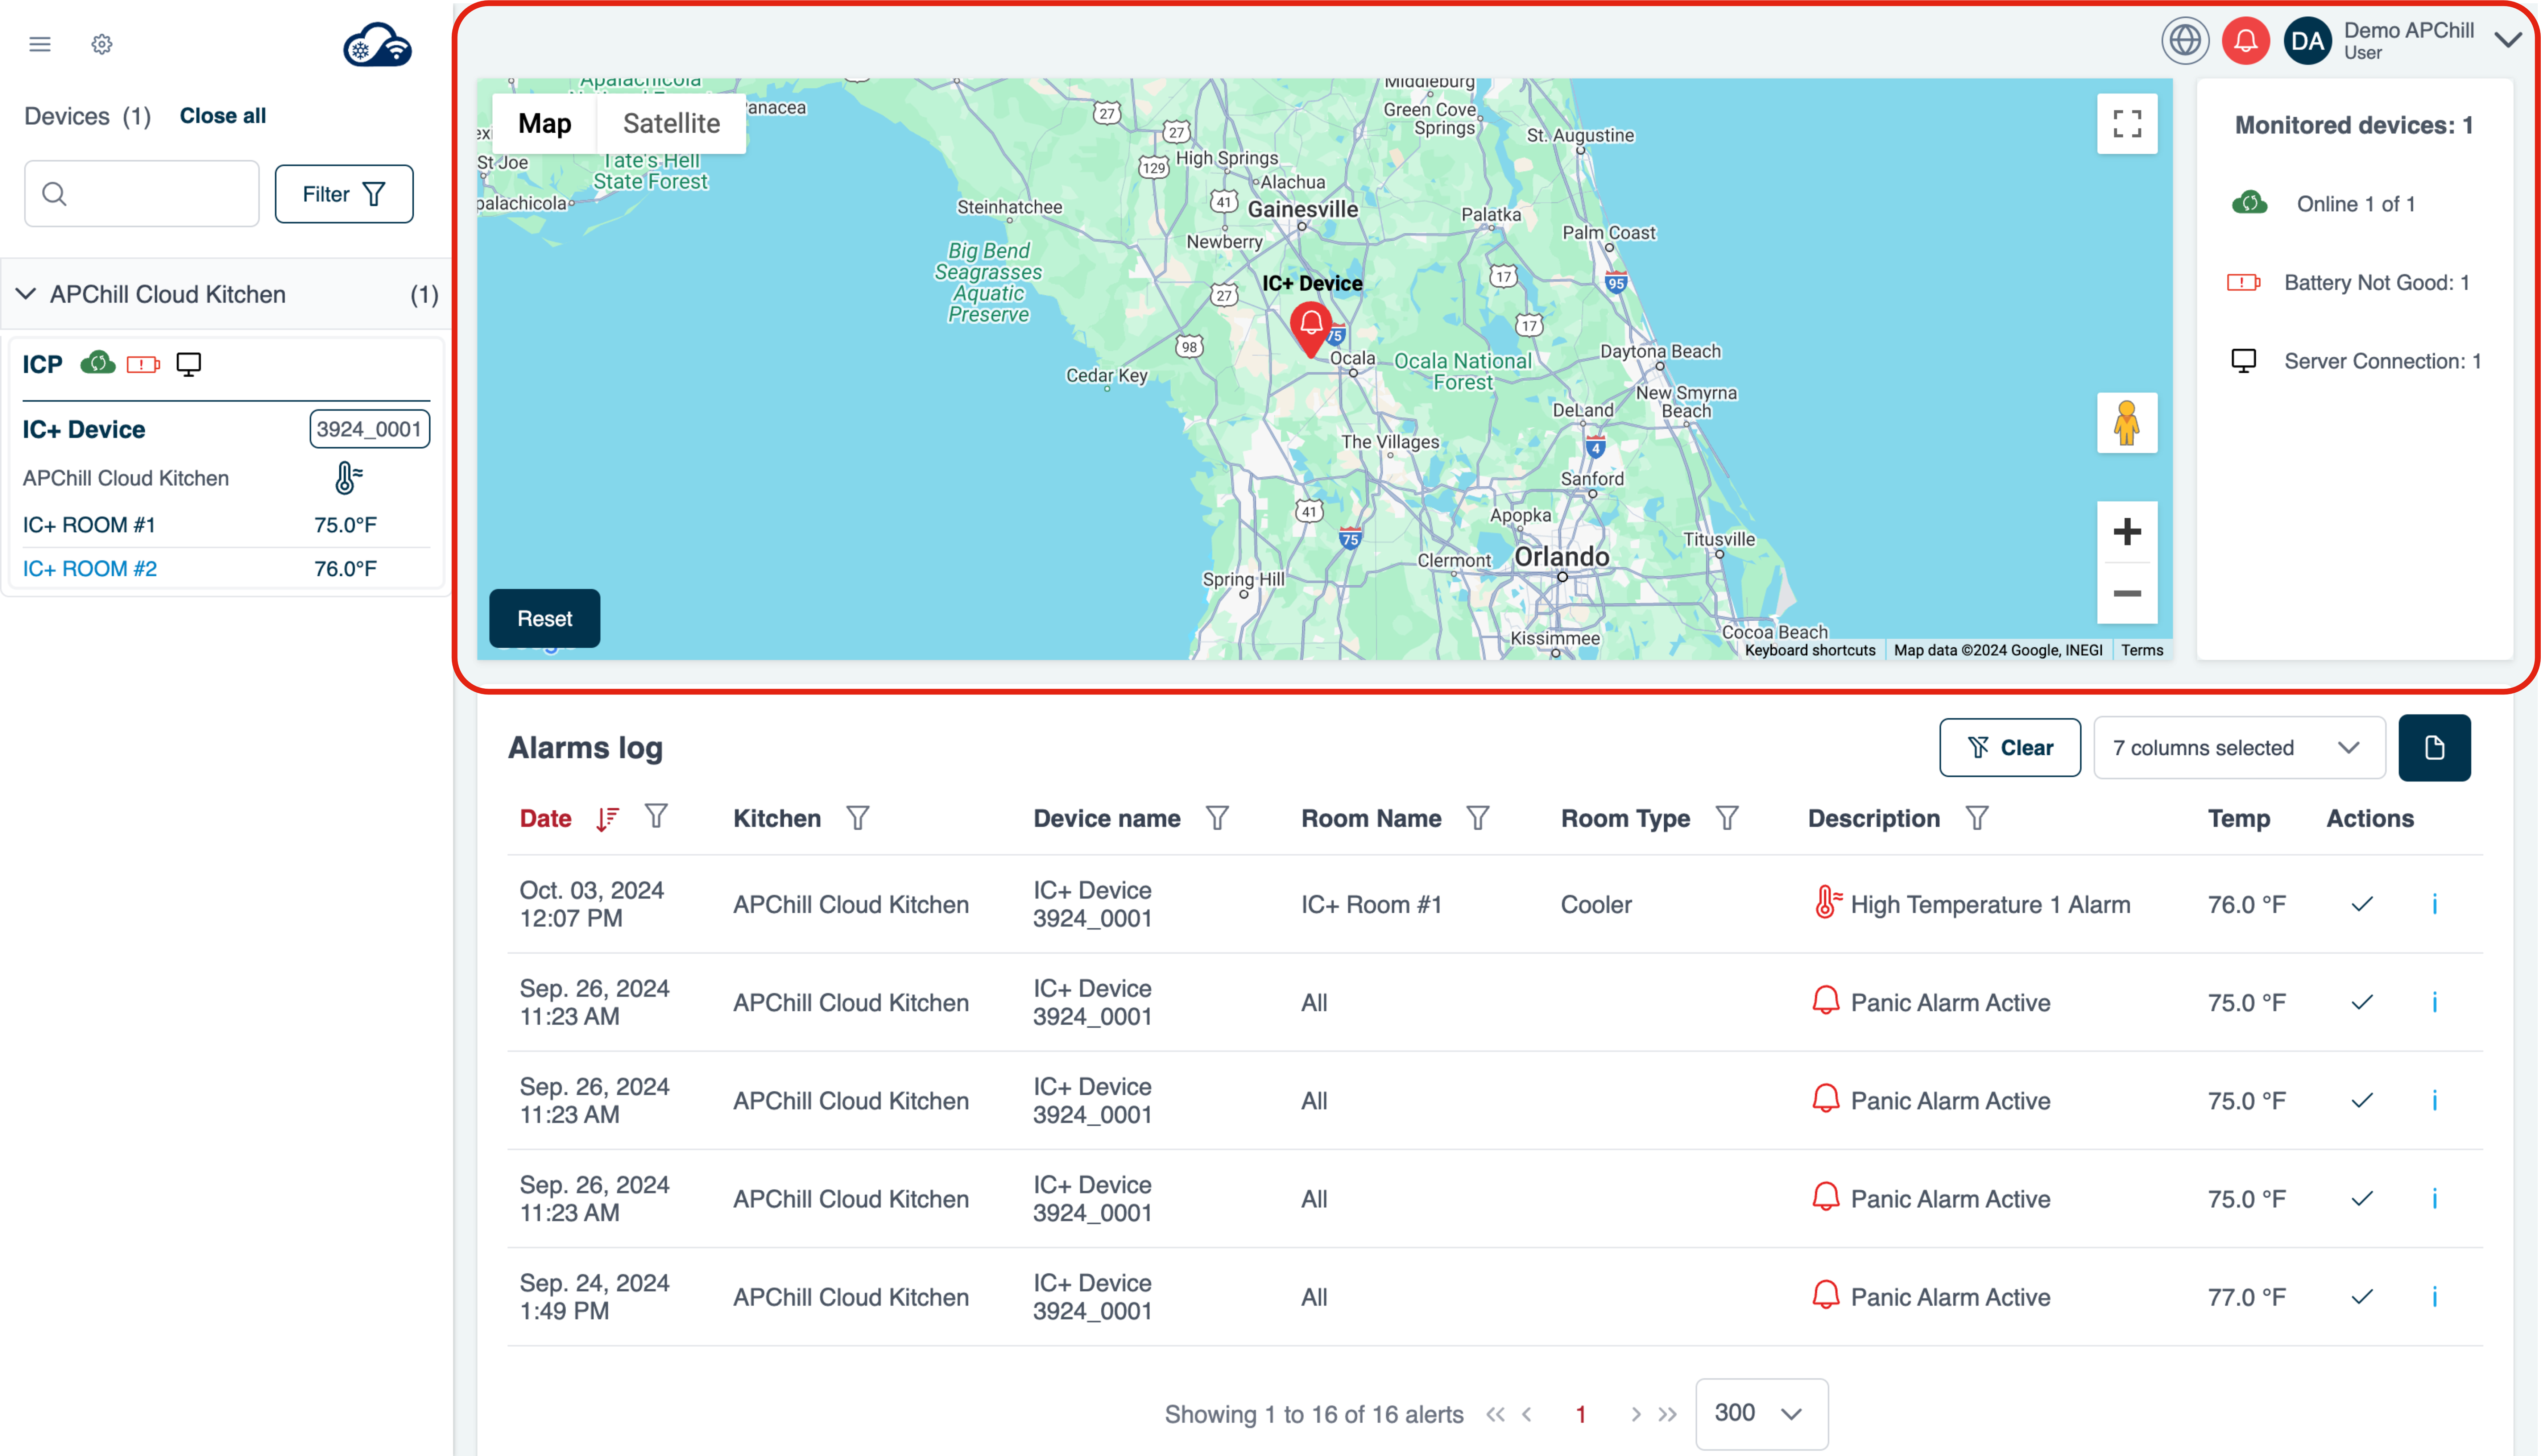
Dashboard explanation
Devices – Grouped by Kitchen
On the left-hand side of your dashboard, you will see a list of all your devices organized by Kitchen. This allows you to:
- Quickly Navigate through different locations and see which devices are associated with each one.
- Select Specific Kitchen to focus on a particular setup and manage the devices within that group.
This grouping feature helps you efficiently manage multiple devices across different locations or organizational units

Map Overview
In the middle of the dashboard, you’ll find a Map that gives you a comprehensive overview of your device network:
- Device Locations: All your devices are displayed on the map, helping you visualize their physical locations.
- Better Overview: This visual representation makes it easier to understand the placement and distribution of devices at a glance, especially useful for larger or distributed setups.

Statistics
To the right of the map, you’ll find the Statistics section:
Device Health and Usage Insights: Here, you can view summaries such as device statuses, performance statistics, and usage analytics, giving you valuable insights into your network’s overall health.
General Information: This area provides aggregated data and key metrics about your devices and their activity.

Alarm Log
Below the map and statistics, you’ll find the Alarm Log:
- Centralized Log of Alarms: This feature collects and displays all the alarms generated by your devices in the recent period.
- Data Filtering and Ordering: You can filter alarms by different criteria—such as date, severity, or type—and order them accordingly, allowing for efficient monitoring and troubleshooting.
- Quick Response to Issues: This centralized view of alarms helps you address any issues promptly, minimizing potential disruptions.

