Search APChill Cloud Guide
Monitoring Dashboard Overview
The Device Monitoring Dashboard is your central location for managing and monitoring all aspects of your IoT devices. It is equipped with all the necessary tools to help you keep track of device performance, share device access, analyze data, and manage settings effectively.
Key Features of the Device Monitoring Dashboard
Device Card (Top Section)
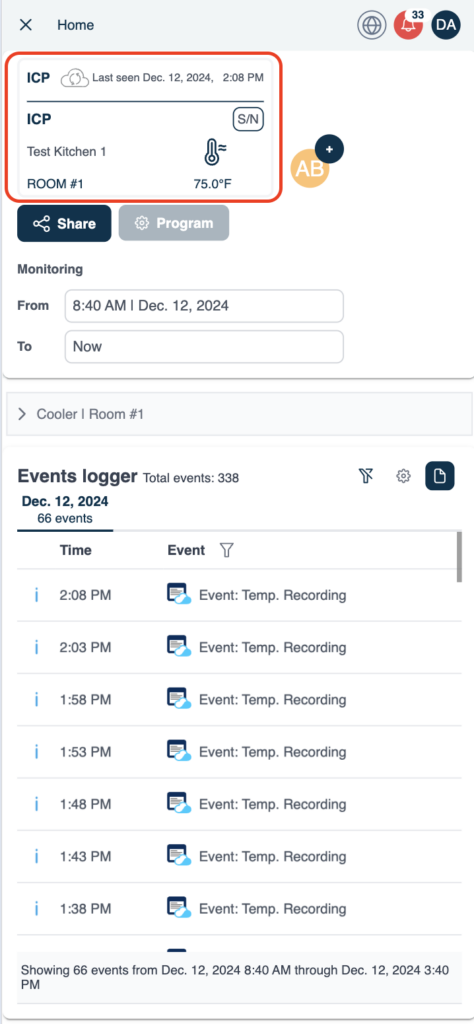
- At the very top of the monitoring dashboard, you’ll see the Device Card.
- This card provides a quick summary of the key device details, including device type, status, battery level, and other important attributes.
- The device card remains visible for easy reference while navigating other sections of the dashboard.
Device Sharing&Programming Feature
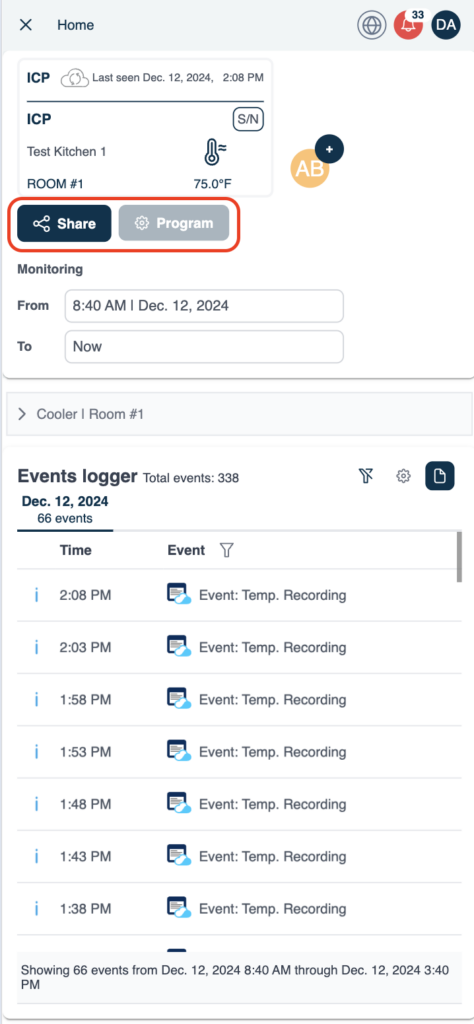
- Right near the device card, you’ll find the Device Sharing & Programming feature.
- This feature allows you to share the device with another user:
- You can share with a user who is part of your kitchen or someone who is not yet part of your kitchen.
- Assign Access Privileges such as:
- Editing Parameters: Allow users to modify specific device settings.
- Deleting Device: Permit users to remove the device from the platform.
- Editing Device Details: Let others update the device name, location, or other attributes.
- Device Control Access: Manage permissions to use or operate the device.
- This flexibility makes it easier to collaborate and manage devices within a shared environment.
Monitoring Period Selection
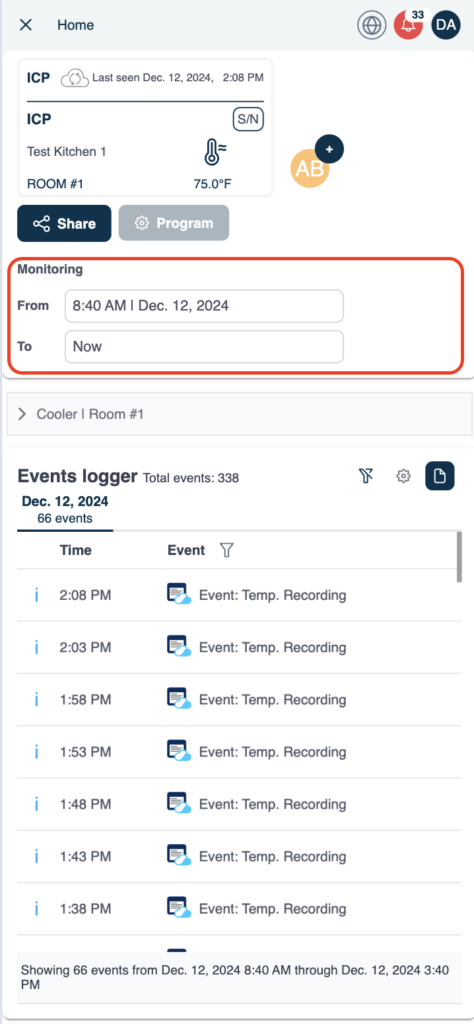
- Also located at the top, next to the sharing options, is the Monitoring Period selector.
- This tool allows you to access device data for different time frames:
- Up to 3 Months of historical data is available for in-depth analysis.
- Choose from predefined Custom Periods like:
- This Year
- One Month
- This Week
- Utilize various Data Aggregation Functions to filter or analyze data based on your specific needs, providing flexibility in how you visualize and manage device information.
Graphical Charts for Monitored Rooms
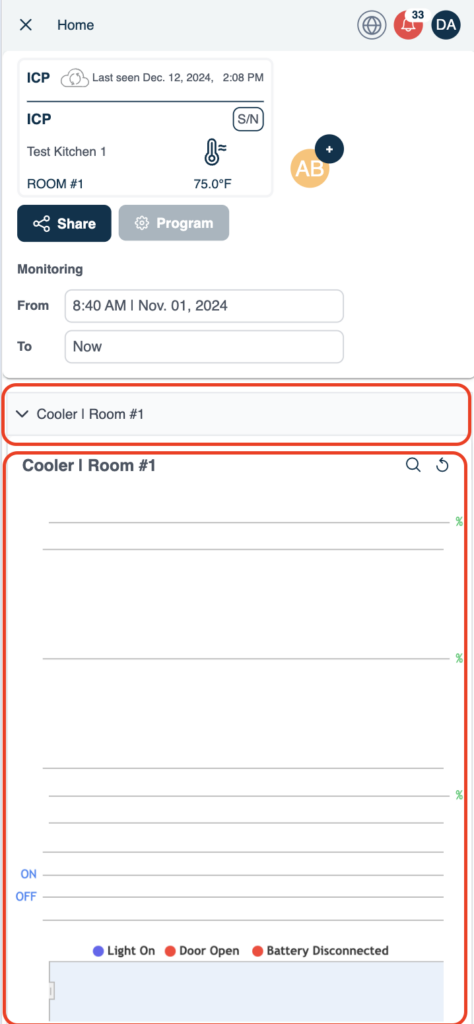
- Below the top section, you will find Graphical Charts for each room monitored by the device.
- These charts provide a visual representation of key metrics, including:
- Temperature Trends: Track temperature changes over time in each monitored room.
- Alarms and Periodic Events: Easily identify alarms triggered in the past, as well as any periodic activities the device has performed.
- The visual aspect of these charts allows for a clearer understanding of environmental data and helps identify trends or anomalies at a glance.
Events Logger
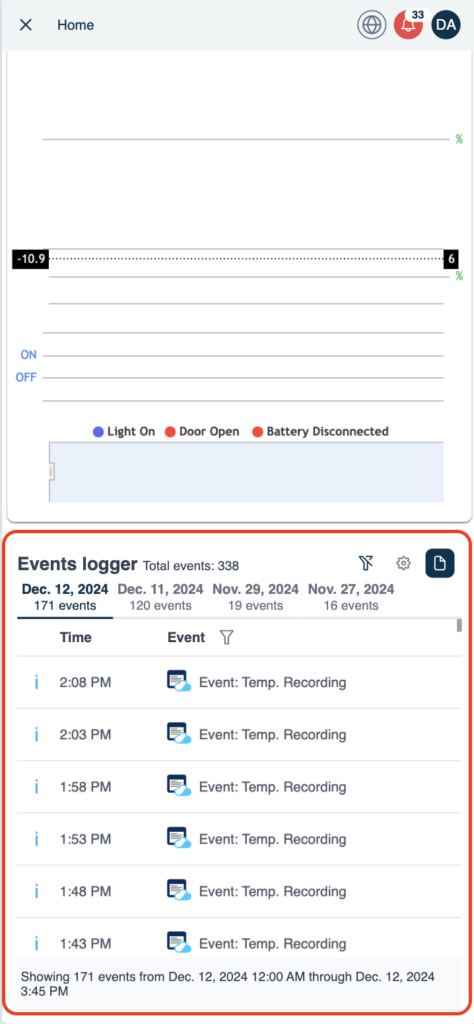
- At the bottom of the monitoring dashboard, you’ll find the Events Logger.
- The events logger is designed to provide a comprehensive view of all device activities:
- Detailed Event Data: See all data, including the date and time of each recorded event.
- Room Temperature Values: Track the temperature readings of monitored rooms.
- Inputs and Outputs Information: Monitor the inputs received by the device and the outputs it generated, providing detailed insight into device behavior.
- This log is essential for reviewing device history, understanding behavior patterns, and troubleshooting any issues that may arise.
